


Moving Average Convergence Divergence (MACD) is a popular technical indicator used in trading to identify potential buy and sell opportunities, measure trend momentum, and identify reversals. It is a type of momentum oscillator that uses exponential moving averages to assess the power of price movement. Developed by Gerald Appel in the late seventies, it is one of the most widely used momentum indicators due to its simplicity and general effectiveness.
MACD is calculated by subtracting the 26-period exponential moving average (EMA) from the 12-period EMA, resulting in the MACD line. The signal line is a 9-period EMA of the MACD line. A histogram is then created by subtracting the signal line from the MACD line. The histogram oscillates above and below a zero line, indicating whether the MACD line is above or below the signal line. Traders use the MACD to identify potential buy and sell signals, as well as to confirm the strength of a trend.
Understanding MACD is essential for traders who want to use it to their advantage. There are several MACD trading strategies, including crossover, divergence, and overbought/oversold. The crossover strategy involves buying when the MACD line crosses above the signal line and selling when it crosses below. The divergence strategy involves looking for divergences between the MACD and price. The overbought/oversold strategy involves looking for overbought or oversold conditions when the MACD is above or below certain levels. Ultimately, the key to successful trading with MACD is to combine it with other technical indicators and to use it in conjunction with sound trading principles.
Key Takeaways
- MACD is a popular momentum oscillator used to identify potential buy and sell opportunities, measure trend momentum, and identify reversals.
- MACD is calculated by subtracting the 26-period exponential moving average (EMA) from the 12-period EMA, resulting in the MACD line.
- There are several MACD trading strategies, including crossover, divergence, and overbought/oversold. Successful trading with MACD involves combining it with other technical indicators and using sound trading principles.
Understanding MACD
Moving Average Convergence Divergence (MACD) is a popular technical analysis indicator used by traders to identify potential buy and sell signals. It is a trend-following momentum indicator that shows the relationship between two moving averages of prices. The MACD indicator is calculated by subtracting the 26-period Exponential Moving Average (EMA) from the 12-period EMA.
Components and Calculation
The MACD line is the difference between the 12-period EMA and the 26-period EMA. The signal line is a 9-period EMA of the MACD line. The histogram is the difference between the MACD line and the signal line. The formula for calculating the MACD line is:
MACD line = 12-period EMA – 26-period EMA
The formula for calculating the signal line is:
Signal line = 9-period EMA of MACD line
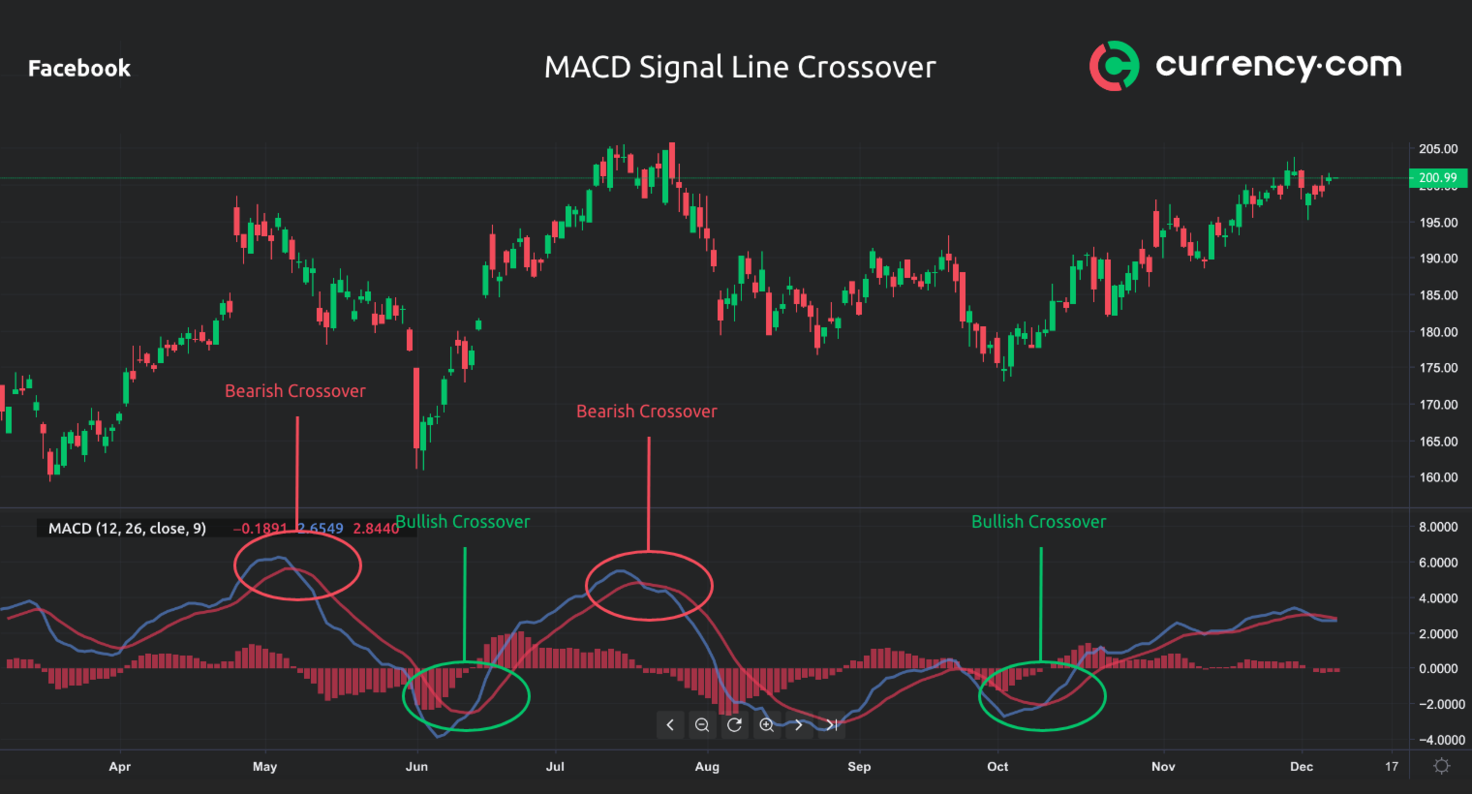
MACD Signal Line and Histogram
The signal line is plotted on top of the MACD line and functions as a trigger for buy and sell signals. When the MACD line crosses above the signal line, it is considered a bullish signal. When the MACD line crosses below the signal line, it is considered a bearish signal. The histogram is used to measure the distance between the MACD line and the signal line. When the histogram is above the zero line, it indicates that the MACD line is above the signal line, which is a bullish signal. When the histogram is below the zero line, it indicates that the MACD line is below the signal line, which is a bearish signal.
Interpreting MACD
Traders use the MACD indicator to identify potential buy and sell signals. When the MACD line crosses above the signal line, it is considered a bullish signal and traders may look to buy the security. When the MACD line crosses below the signal line, it is considered a bearish signal and traders may look to sell the security. The zero line is an important level to watch as it represents the point where the MACD line and the signal line intersect. When the MACD line is above the zero line, it indicates that the security is in an uptrend. When the MACD line is below the zero line, it indicates that the security is in a downtrend. The default settings for the MACD indicator are 12, 26, and 9. However, traders may adjust these settings to suit their trading style and preferences.
MACD Trading Strategies
Moving Average Convergence Divergence (MACD) is a popular momentum indicator that traders use to identify potential buy and sell signals in the market. The following trading strategies can be used with MACD to help traders make informed decisions.
Trend-Following and Reversals
One of the most common MACD trading strategies is trend-following. Traders can use MACD to identify the trend direction and enter trades in the direction of the trend. When the MACD line crosses above the signal line, it is a bullish signal and traders can consider entering a long position. Conversely, when the MACD line crosses below the signal line, it is a bearish signal and traders can consider entering a short position.
Reversals can also be identified using MACD. When the MACD line crosses above the signal line, it is a bullish crossover and traders can consider entering a long position. When the MACD line crosses below the signal line, it is a bearish crossover and traders can consider entering a short position. However, traders should be cautious of false signals and whipsaws, which can occur when the price movement is choppy.
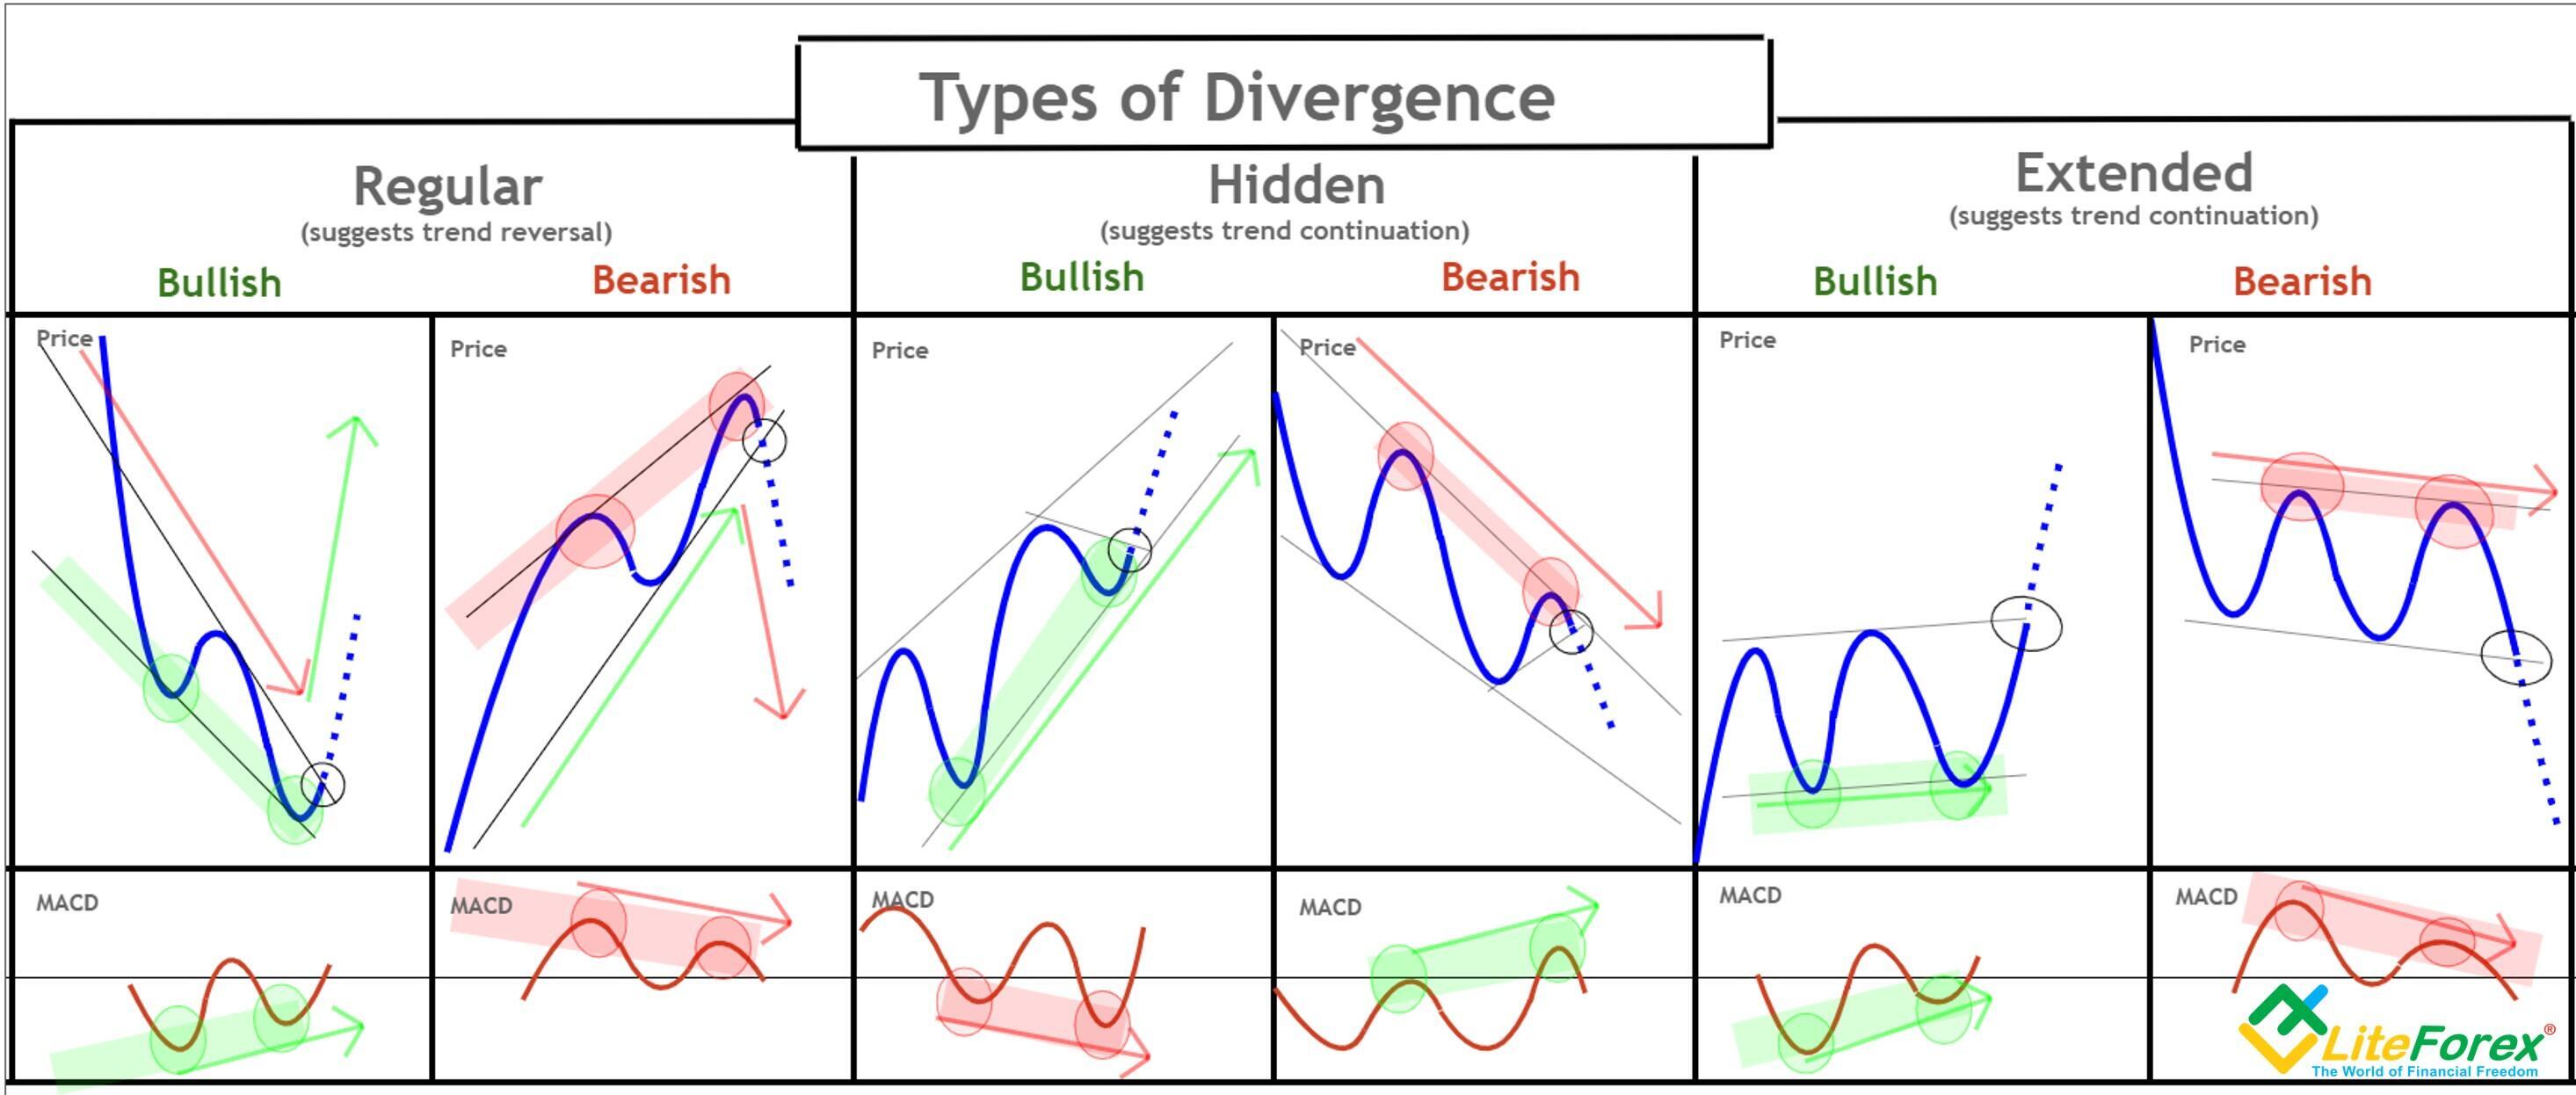
Divergence and Convergence Signals
Another MACD trading strategy is to use divergence and convergence signals. Bullish divergence occurs when the price action is making lower lows, but the MACD is making higher lows. This is a potential buy signal as it suggests that the price may reverse and move higher. Conversely, bearish divergence occurs when the price action is making higher highs, but the MACD is making lower highs. This is a potential sell signal as it suggests that the price may reverse and move lower.
Traders can also use MACD to identify convergence signals. When the MACD line and signal line are moving in the same direction, it suggests that the trend is strong. When the MACD line and signal line are moving in opposite directions, it suggests that the trend may be losing momentum.
Strengths and Limitations
While MACD can be a useful trading tool, it is important to be aware of its strengths and limitations. MACD is a lagging indicator, which means that it may not provide timely signals in fast-moving markets. Traders should also be cautious of false signals and whipsaws, which can occur when the price movement is choppy. Additionally, MACD may not work well in markets that are oversold or overbought.
In summary, MACD is a popular momentum indicator that traders can use to identify potential buy and sell signals in the market. Traders can use trend-following and reversal strategies, as well as divergence and convergence signals, to make informed trading decisions. However, traders should be aware of the strengths and limitations of MACD and use it in conjunction with other technical indicators and price action analysis.